| CroninProjects.org/ Vince/ PlateKinematics/ KinematicsPrimer/ Ex6-2.html |
|---|
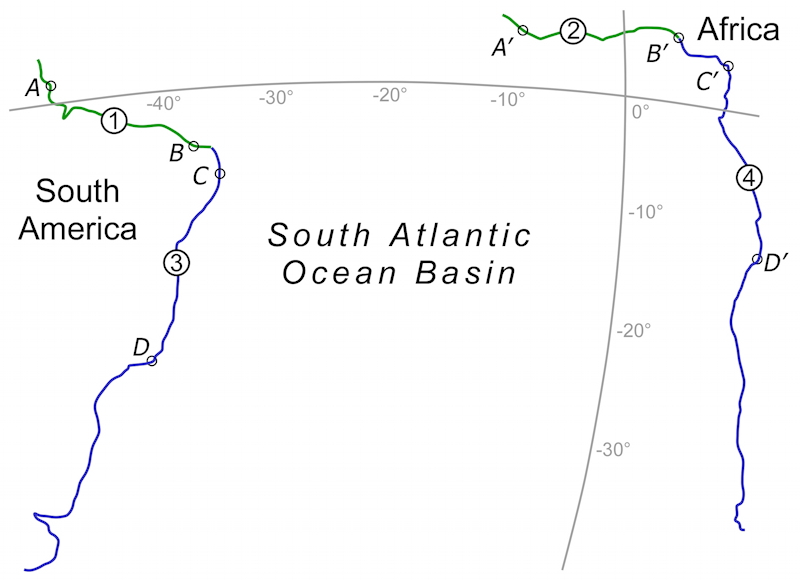
Orthographic projection of present-day coastlines across the South Atlantic Ocean Basin, from data compiled by Seton and others (2012) and a map adapted from GPlates. Boundary sections 1 and 2 were originally adjacent prior to continental breakup, as were boundaries 3 and 4.
Exercise 6.2 It can be said that the fit of Africa and South America is the earliest plate-kinematic problem, dating from before
Wegener and his continental-drift ideas. Jim Everett was the first to employ a computational analysis to find a best-fit solution (Bullard
et al., 1965). His solution employed the 500 m isobath around the continents to approximate the boundary between continental crust
and oceanic crust, and he made the reasonable first-order assumption that both continents have been rigid (without internal deformation) since the time of initial breakup.
Many other kinematic analyses have followed (e.g., Moulin, et al., 2010).
In this exercise, you will determine two total-opening poles associated with the opening of the south Atlantic Ocean Basin: one for the
part north of a line between around Natal, Brazil, and the Niger River Delta, Nigeria, and a second for the part south of that line. The
reason for this division is that internal deformation of one or both of the continents has changed the shape of their initial boundaries,
and so dividing the problem in two is a first-order attempt to accommodate this problem. Four Excel files are provided (links below) that contain points along the north and south boundary
zones of South America and Africa, with location data taken along the present-day continents as
compiled by Seton and others (2012). For convenience, we will call the northern boundary of the South American continent boundary
segment 1, the corresponding boundary on Africa will be boundary segment 2, the southern boundary of South America will be
boundary segment 3, and the southern boundary of Africa will be boundary segment 4.
In the table below are the locations of four sets of points that are thought to have been adjacent to one another prior to breakup. These pairs of points were derived from interpretation of a reconstruction map produced using the GPlates software, which is freeware made available by Dietmar Müller and his friends at the University of Sydney. The datafiles embedded in GPlates are by Seton and others (2012).
| Point | Latitude | Longitude | Point | Latitude | Longitude |
|---|---|---|---|---|---|
| A | 1.59° | -49.87° | A’ | 5.14° | -9.23° |
| B | -5.03° | -37.04° | B’ | 5.87° | 5.23° |
| C | -8.25° | -35.00° | C’ | -4.29° | 6.06° |
| D | -38.34° | -57.83° | D’ | -30.51° | 17.35° |
Write a code in Mathematica that will determine the pole of rotation and rotational angle that will
bring points A and B into coincidence with points A’ and B’, respectively. Now do the same for boundaries 3 and 4. Compare your
results with published estimates of the total opening pole for the south Atlantic Ocean Basin (e.g., Bullard and others, 1965, or more recent
estimates).
Finally, write a code in Mathematica that will rotate all of the points in boundaries 2 and 4 around the respective total poles to coincide with boundaries 1 and 3, respectively. That is, illustrate the total rotation of African continental crust as observed from South American continental crust. In so doing, boundaries 1 and 3 will not change their spatial relationship with each other -- you will hold South America to be rigid -- but boundaries 2 and 4 might change their spatial relationship with each other. How would you determine the total motion of boundary 2 relative to boundary 4 during the opening of the South Atlantic?
Useful Sites and Software
If you have any questions or comments about this site or its contents, drop an email to the humble webmaster.
All of the original content of this website is © 2014 by Vincent S. Cronin